
ESG Data Hub
Improving trust and transparency in ESG data collection and validation.
ROLE
Sole UX/UI Designer, driving the product vision from scratch: defining user needs, shaping product requirements, and designing intuitive interfaces. Collaborated in a lean team with a PM, two developers, a data scientist, and a QA engineer
SKILLS
Stakeholder research, survey flow design, advanced data visualization, dashboard creation, rapid prototyping, usability testing, interaction design, and scalable design system
TIMELINE
January – December 2023
OVERVIEW
A cloud-based platform that helps companies monitor and improve sustainability across social, environmental, compliance, risk, and impact areas.
Unlike traditional reporting tools, it transforms stakeholder surveys and questionnaires into interactive dashboards that give executives a real-time view of performance.
As Lead UX/UI Designer, I led the end-to-end product design from start to finish (user research, data collection flows, dashboard information architecture, UX strategy focused on trust and transparency, and design system foundations), working within a small agile team (PM, developers, data scientist, QA).
The Challenge
ESG data is already complex long before it reaches a dashboard. Most companies were already trying to measure their sustainability performance, but the operational reality was highly fragmented:
- HR teams tracked diversity and social metrics in spreadsheets
- Operations monitored emissions in disconnected systems
- Compliance teams managed stakeholder questionnaires manually
- Suppliers submitted data in inconsistent formats
This created major issues:
- Delayed reporting cycles
- Incomplete inputs
- Poor traceability
- Low confidence in final outputs
The core UX challenge became clear: how might we make complex ESG data easier to collect, validate, and understand across different teams, while building trust in the process?
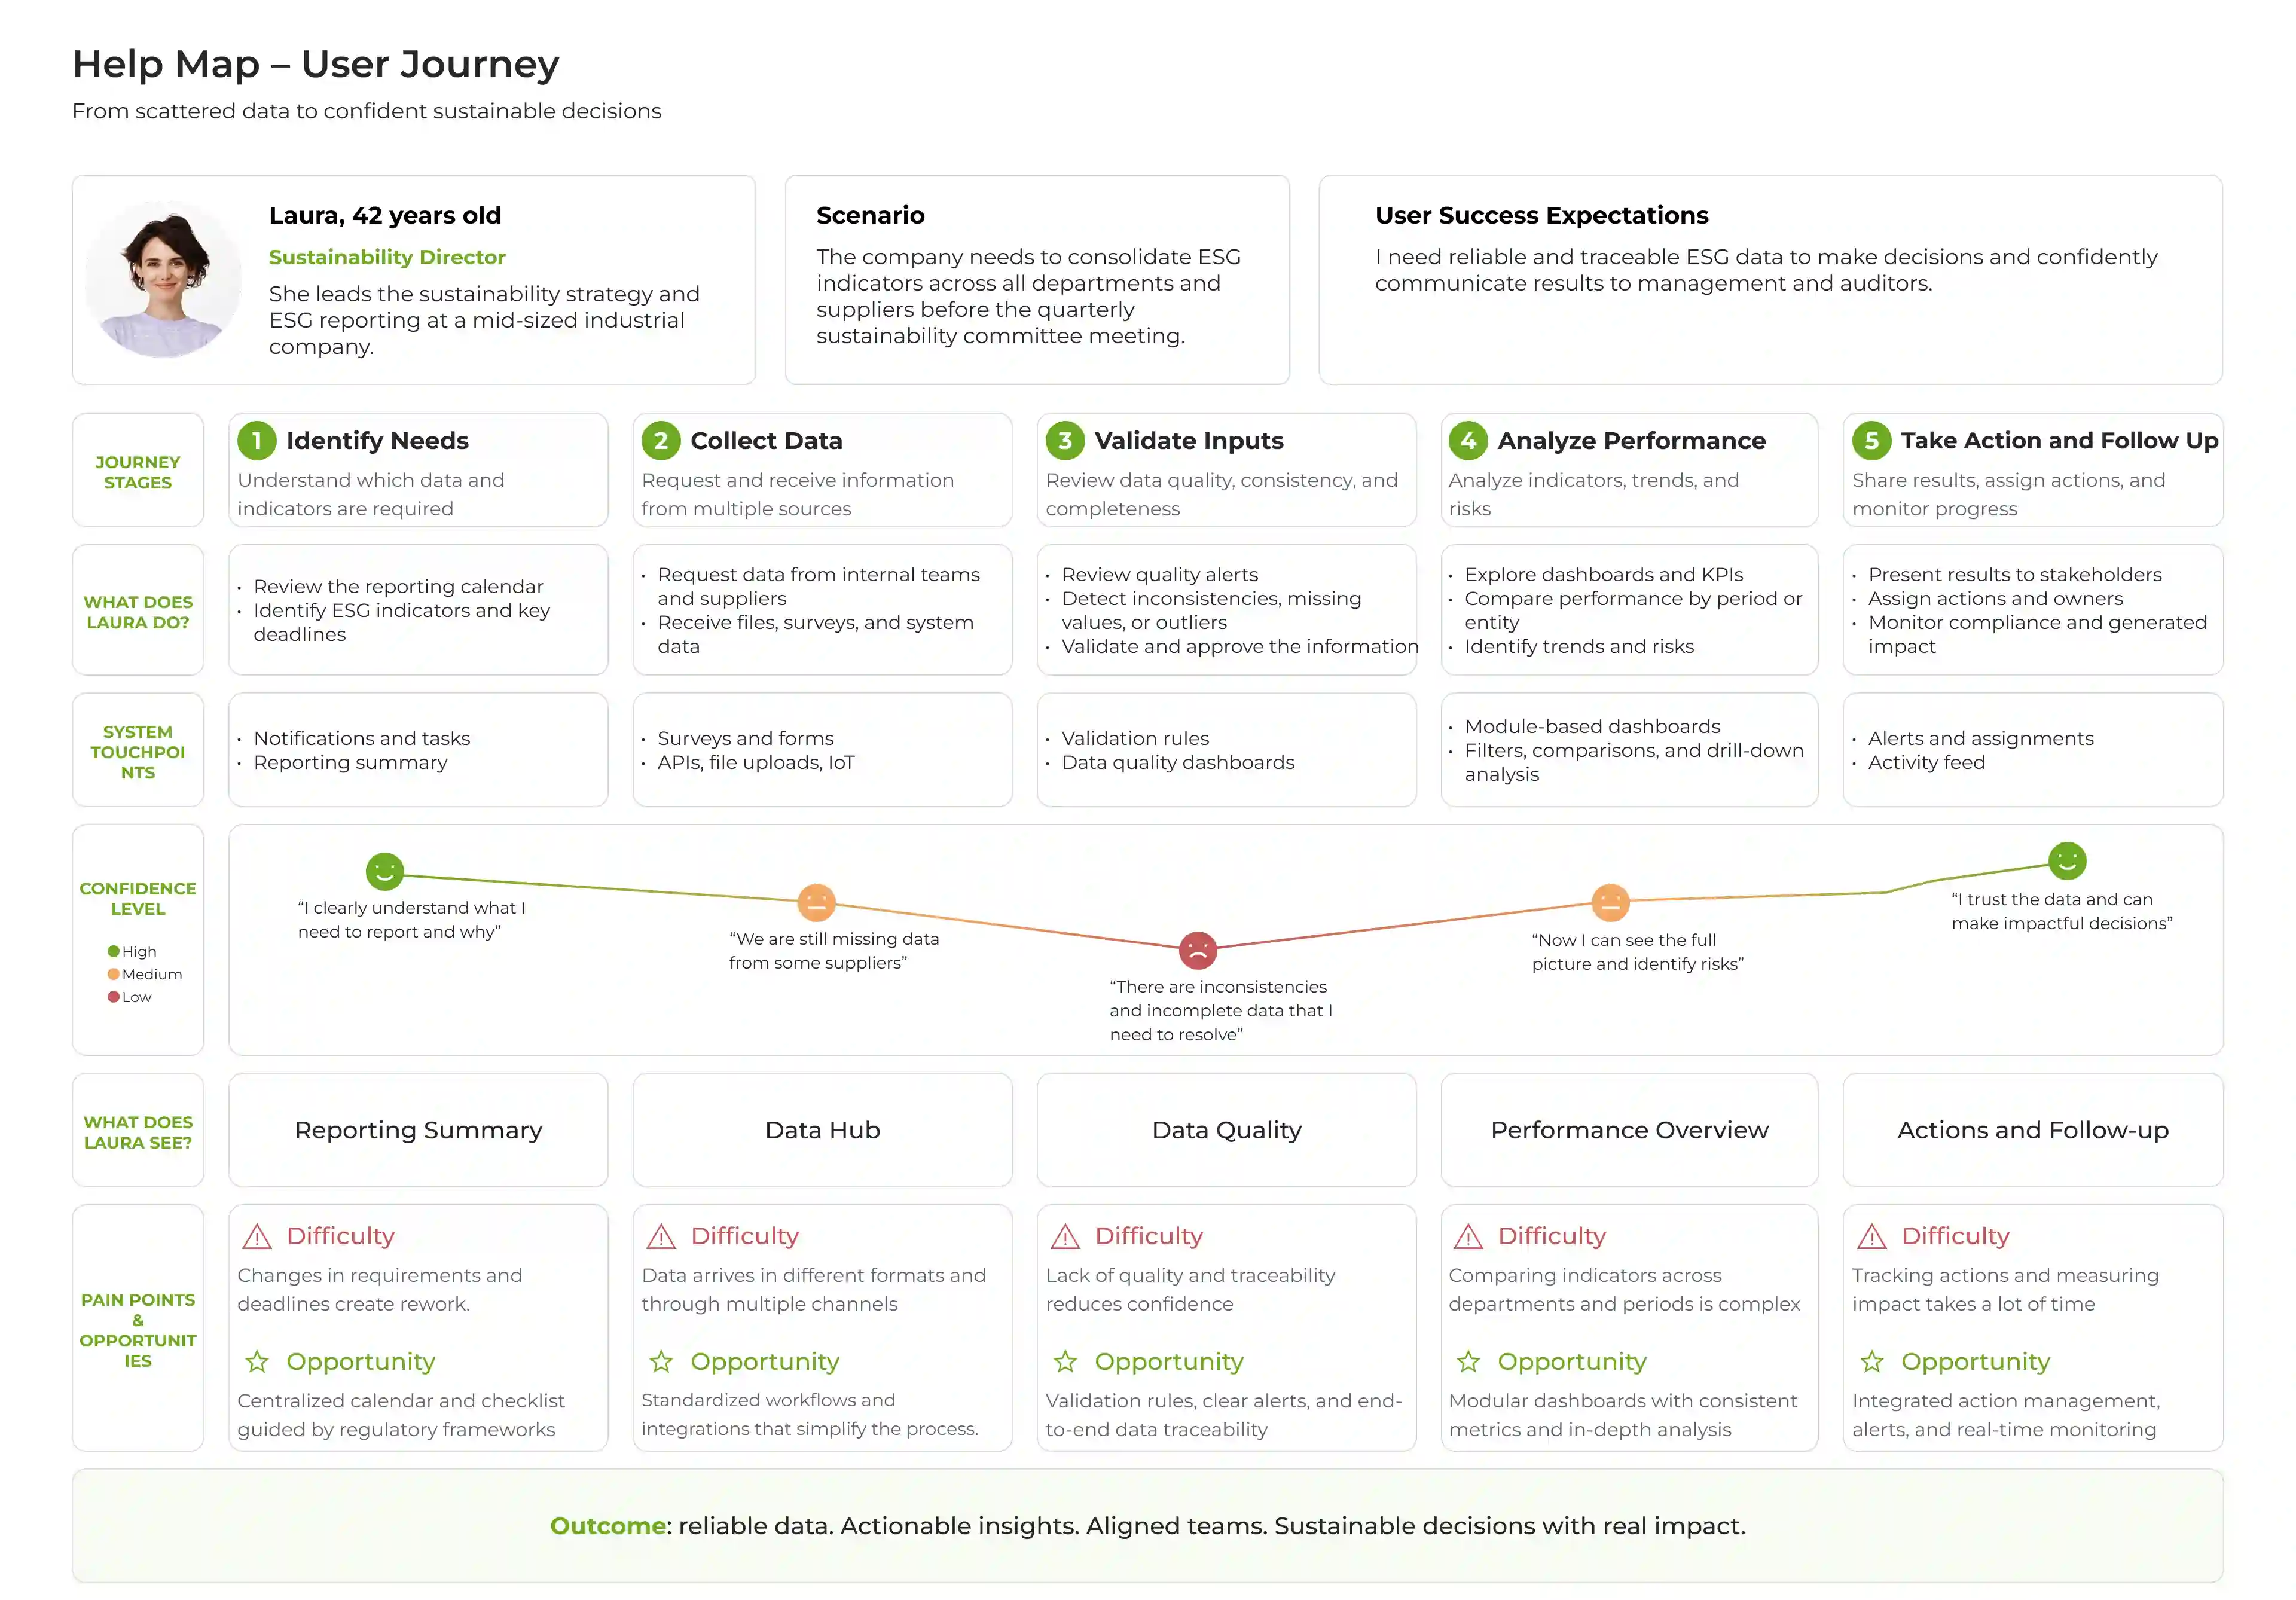
Mapping the operational ESG workflow helped identify friction points across data collection, validation, and decision-making
Research
Through 12 interviews and 12 workshops with sustainability managers, compliance teams, and finance leaders, we uncovered three critical points:
1. Data collection was the biggest bottleneck
Teams were spending weeks chasing data across departments before analysis could even begin.
2. Trust in source data was low
Even when dashboards existed, user often questioned where data came from, whether it was updated or who had validate it.
3. A different roles needed different levels of complexity
A plan manager, HR lead, and CFO had completely different needs and digital maturity.
This shifted our design strategy: before designing insights, we needed to design trust into the input process.
UX Strategy
Instead of focusing only on dashboards, I designed the full experience from raw data collection to executive visibility.
1. Modular survey flows by ESG, compliance, risk, and impact area
A single data entry flow did not address the complexity of the platform’s different modules. I designed flexible, modular survey experiences tailored to each functional area: social, environmental, compliance, risk, and ESG impact.
Key UX decisions:
- Structured question blocks based on the module and type of information required
- Conditional logic to display only relevant fields depending on the context
- Progressive disclosure to simplify lengthy forms
- Save-and-resume functionality to support long completion processes
This approach reduced friction in data collection, improved usability for complex forms, and increased completion rates in ESG reporting and assessment workflows.
%20-%20Wireframe.webp)
Early wireframes explored how to structure modular ESG data collection flows while reducing friction across long and complex workflows
2. Validation logic to improve data quality
One of the main trust issues was inconsistent or incomplete data. To reduce errors, I designed:
- Field-level validation rules
- Alerts for missing critical inputs
- Anomaly flags for unexpected values
- Completion status indicators
Example: if a supplier submitted emissions data outside expected thresholds, the system highlighted it for review before submission. Users could identify issues earlier, instead of discovering problems during reporting.
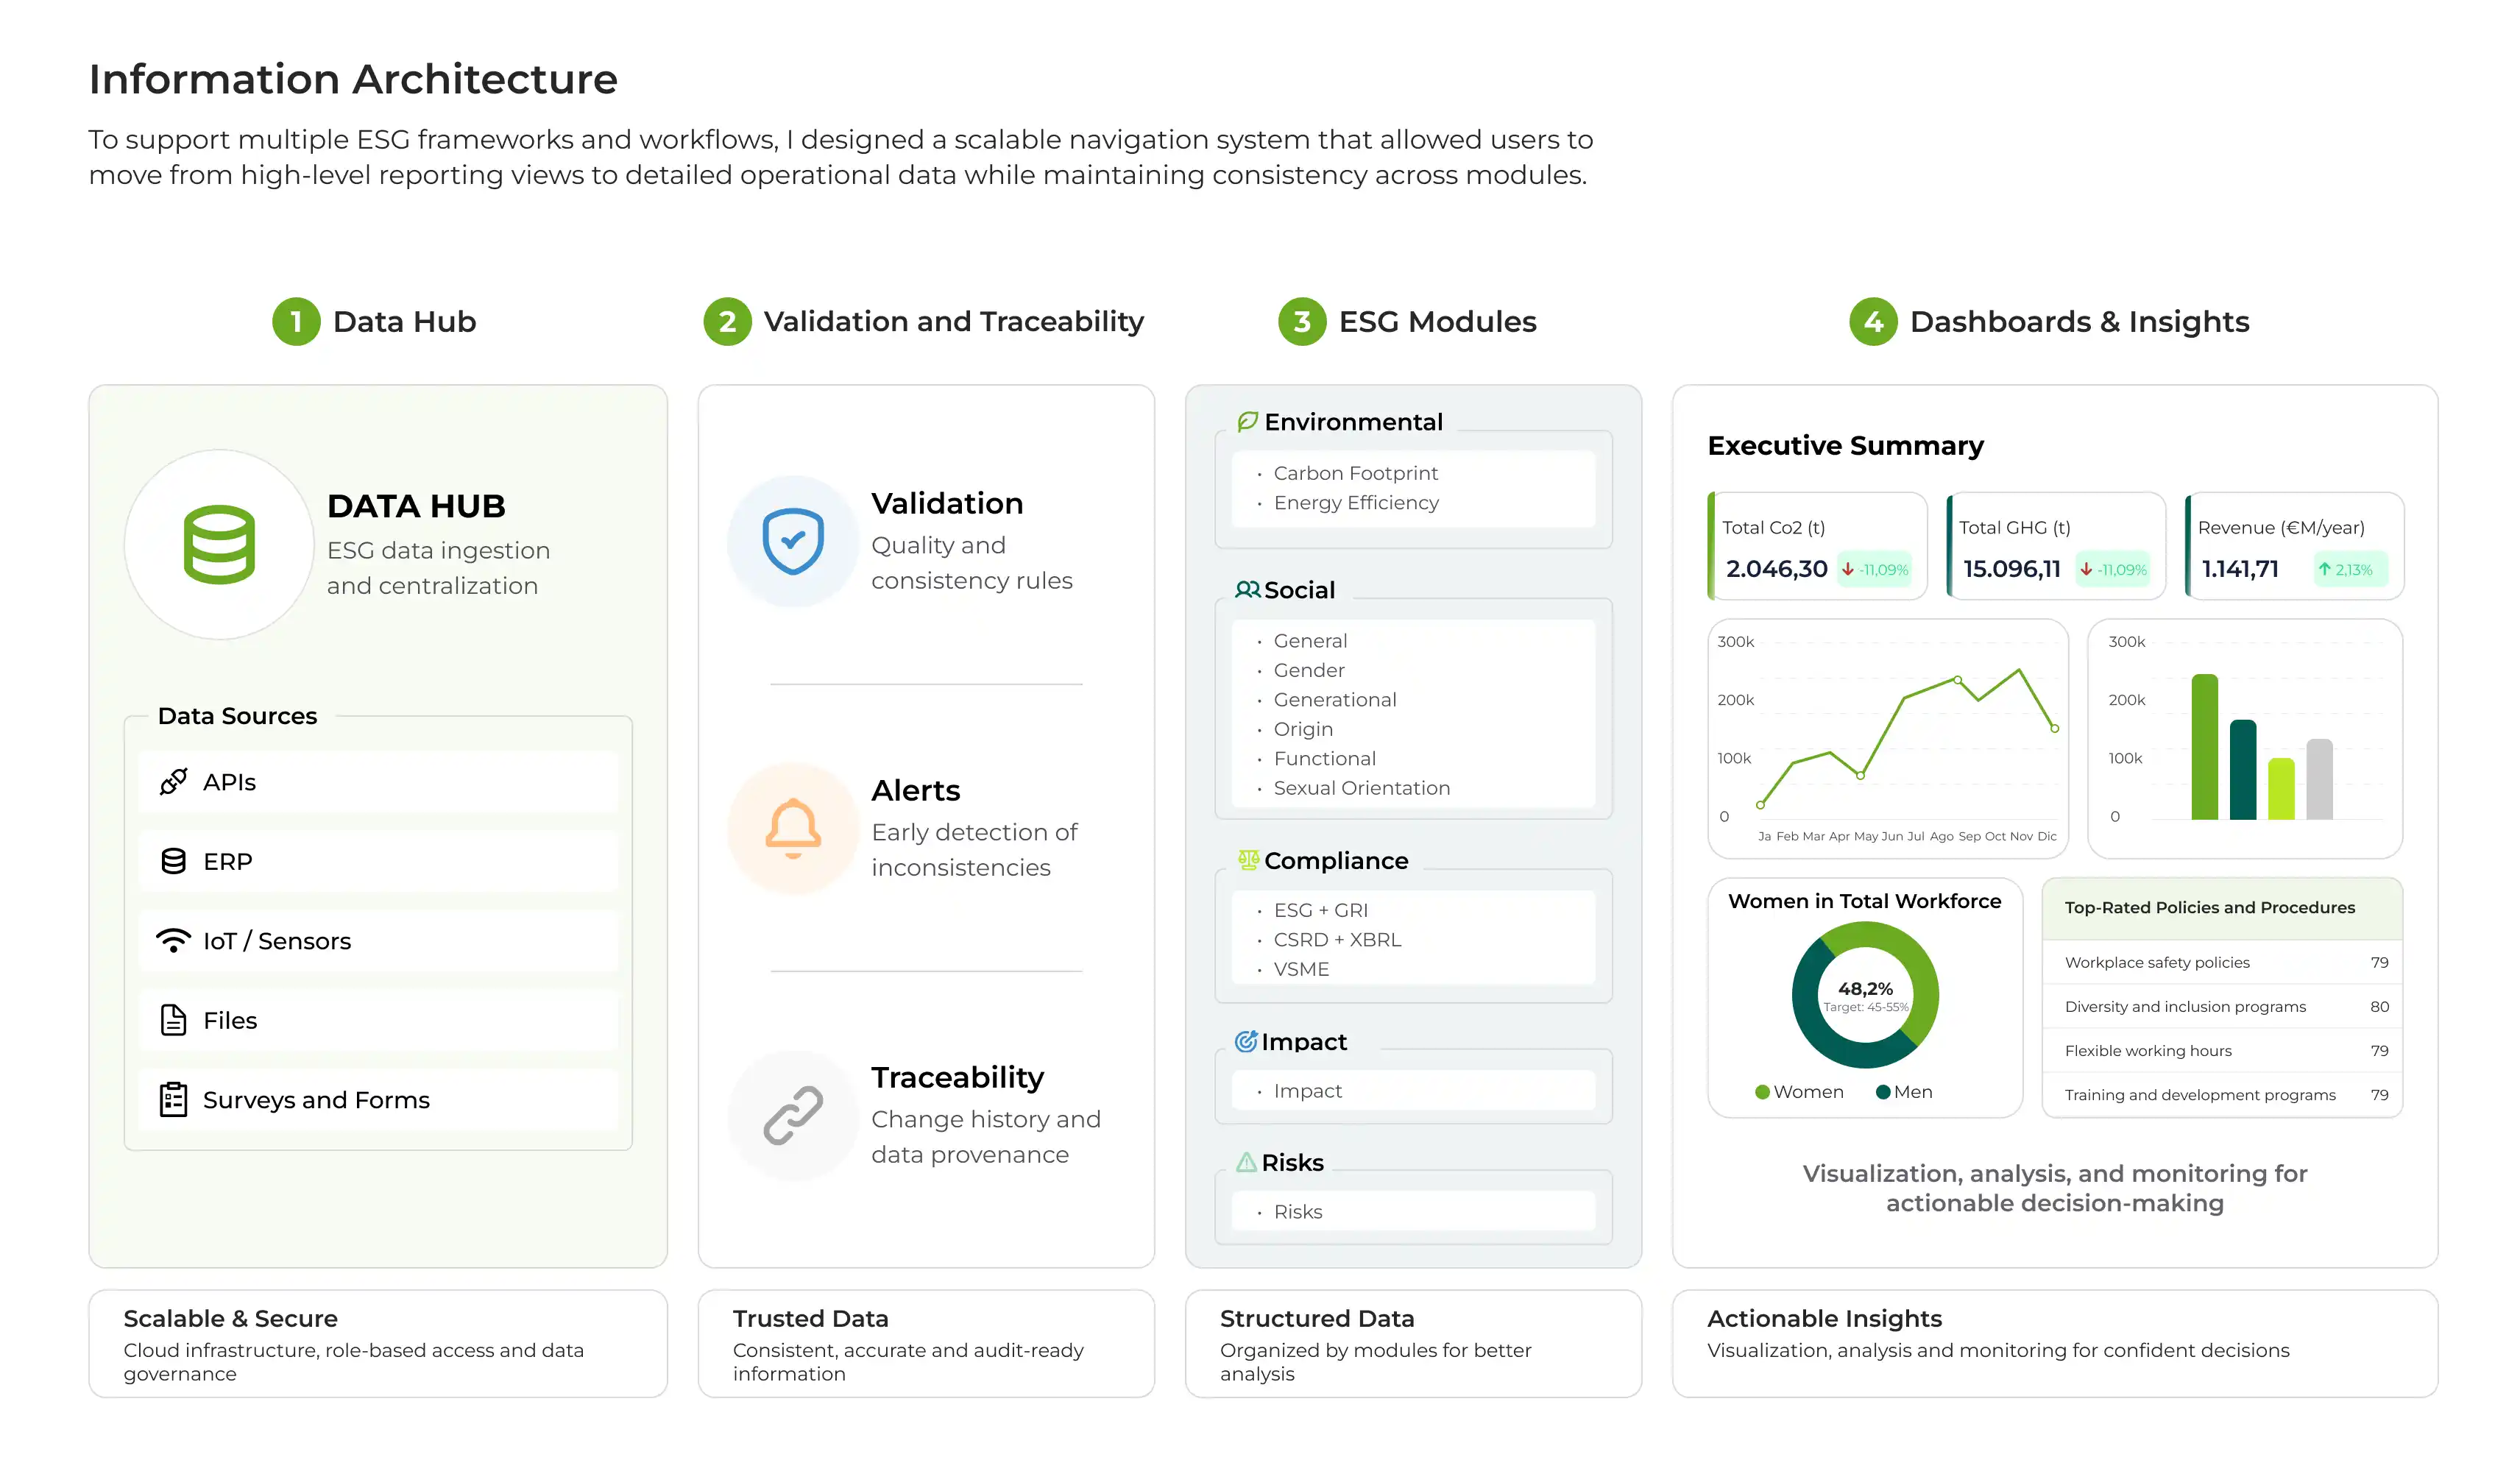
The platform architecture was designed to support scalable ESG modules while making validation and traceability visible across the experience
3. Making ETL and data traceability visible
A major product risk was that data transformation could feel like a black box. To solve this, I introduced trust indicators directly into the product:
- Data source visibility
- Collection status tracking
- Last updated timestamps
- Ownership / validation status
Why it mattered: users needed confidence not only in the dashboard, but in how the data got there. This became one of the most valuable UX contributions in the product.
.webp)
Trust indicators such as ownership, timestamps, and validation status helped users understand where data came from and whether it could be trusted
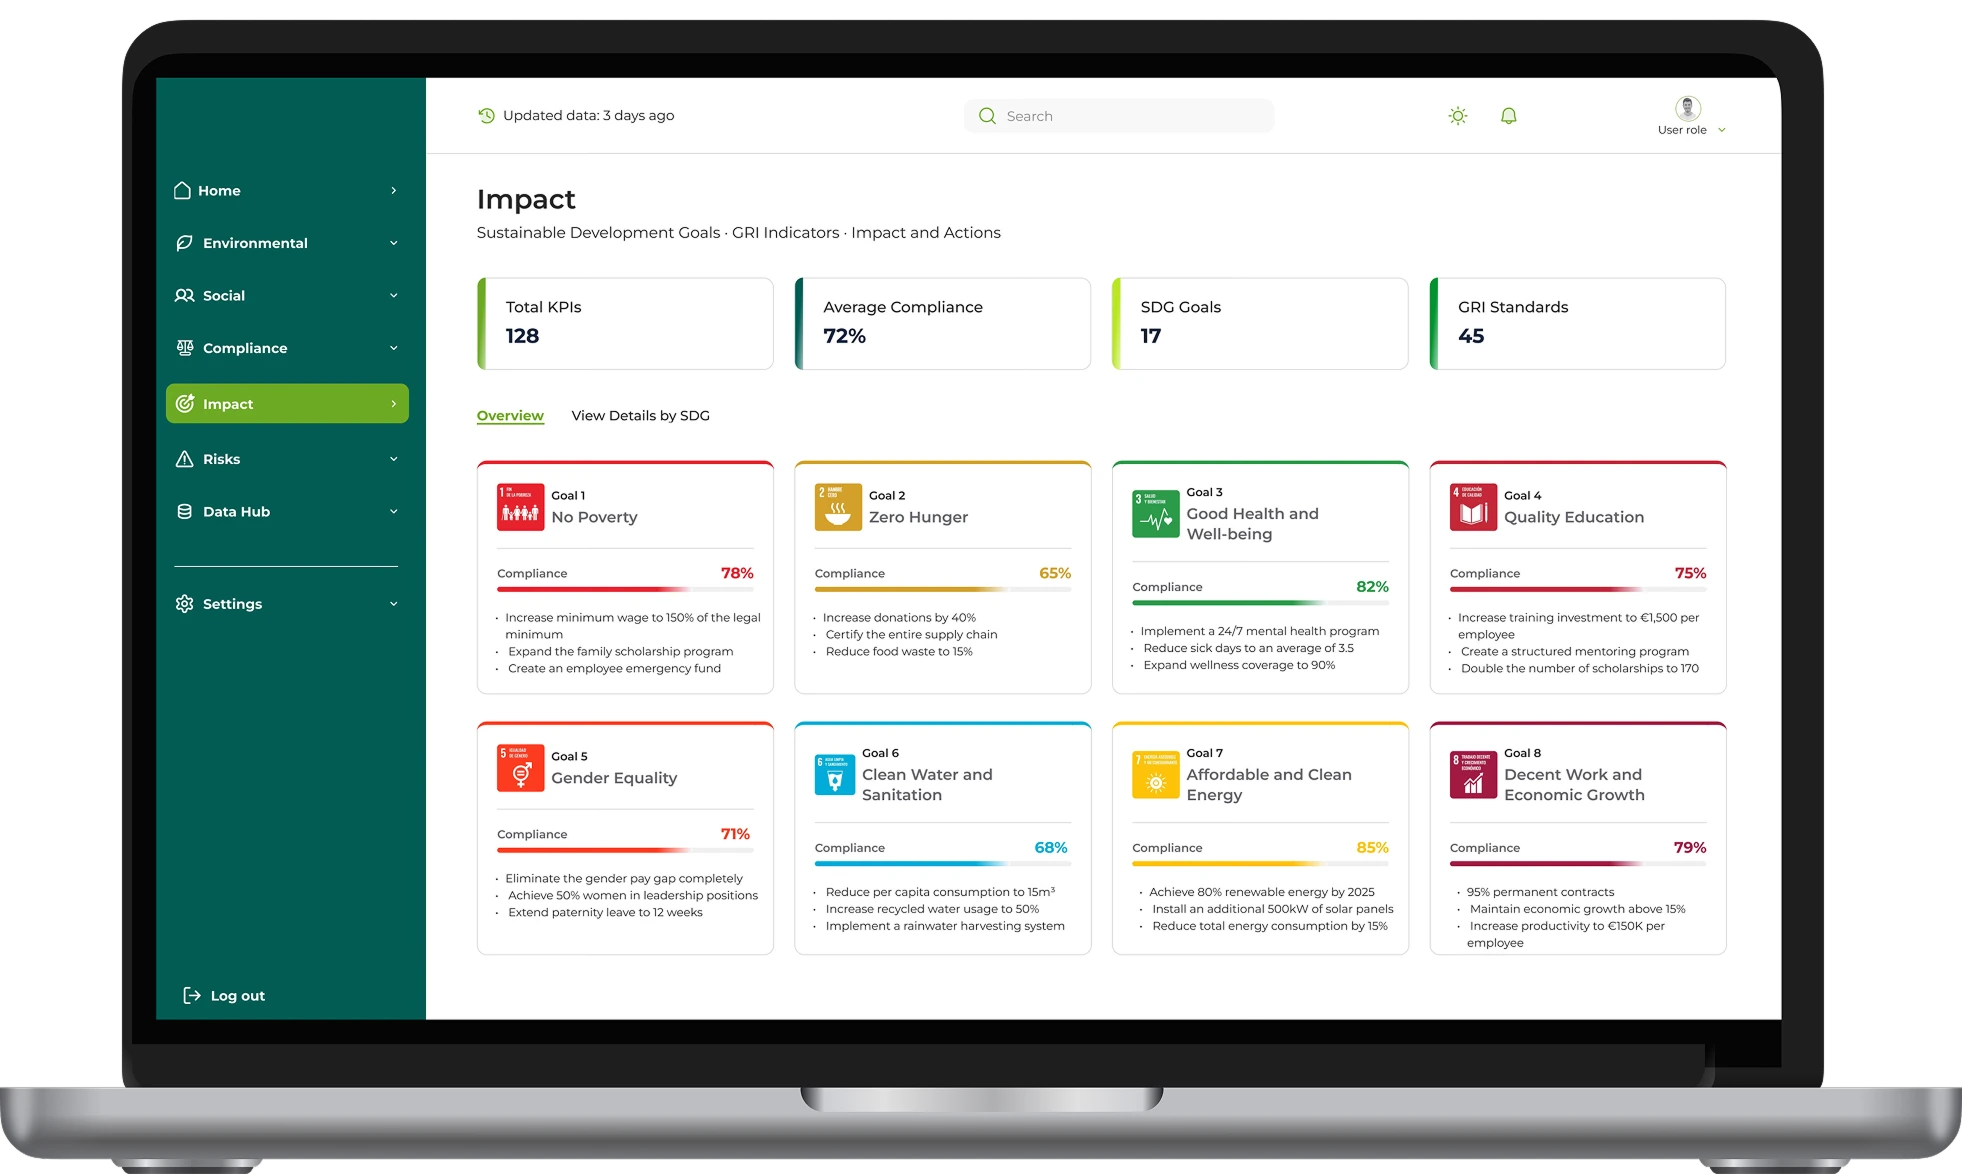
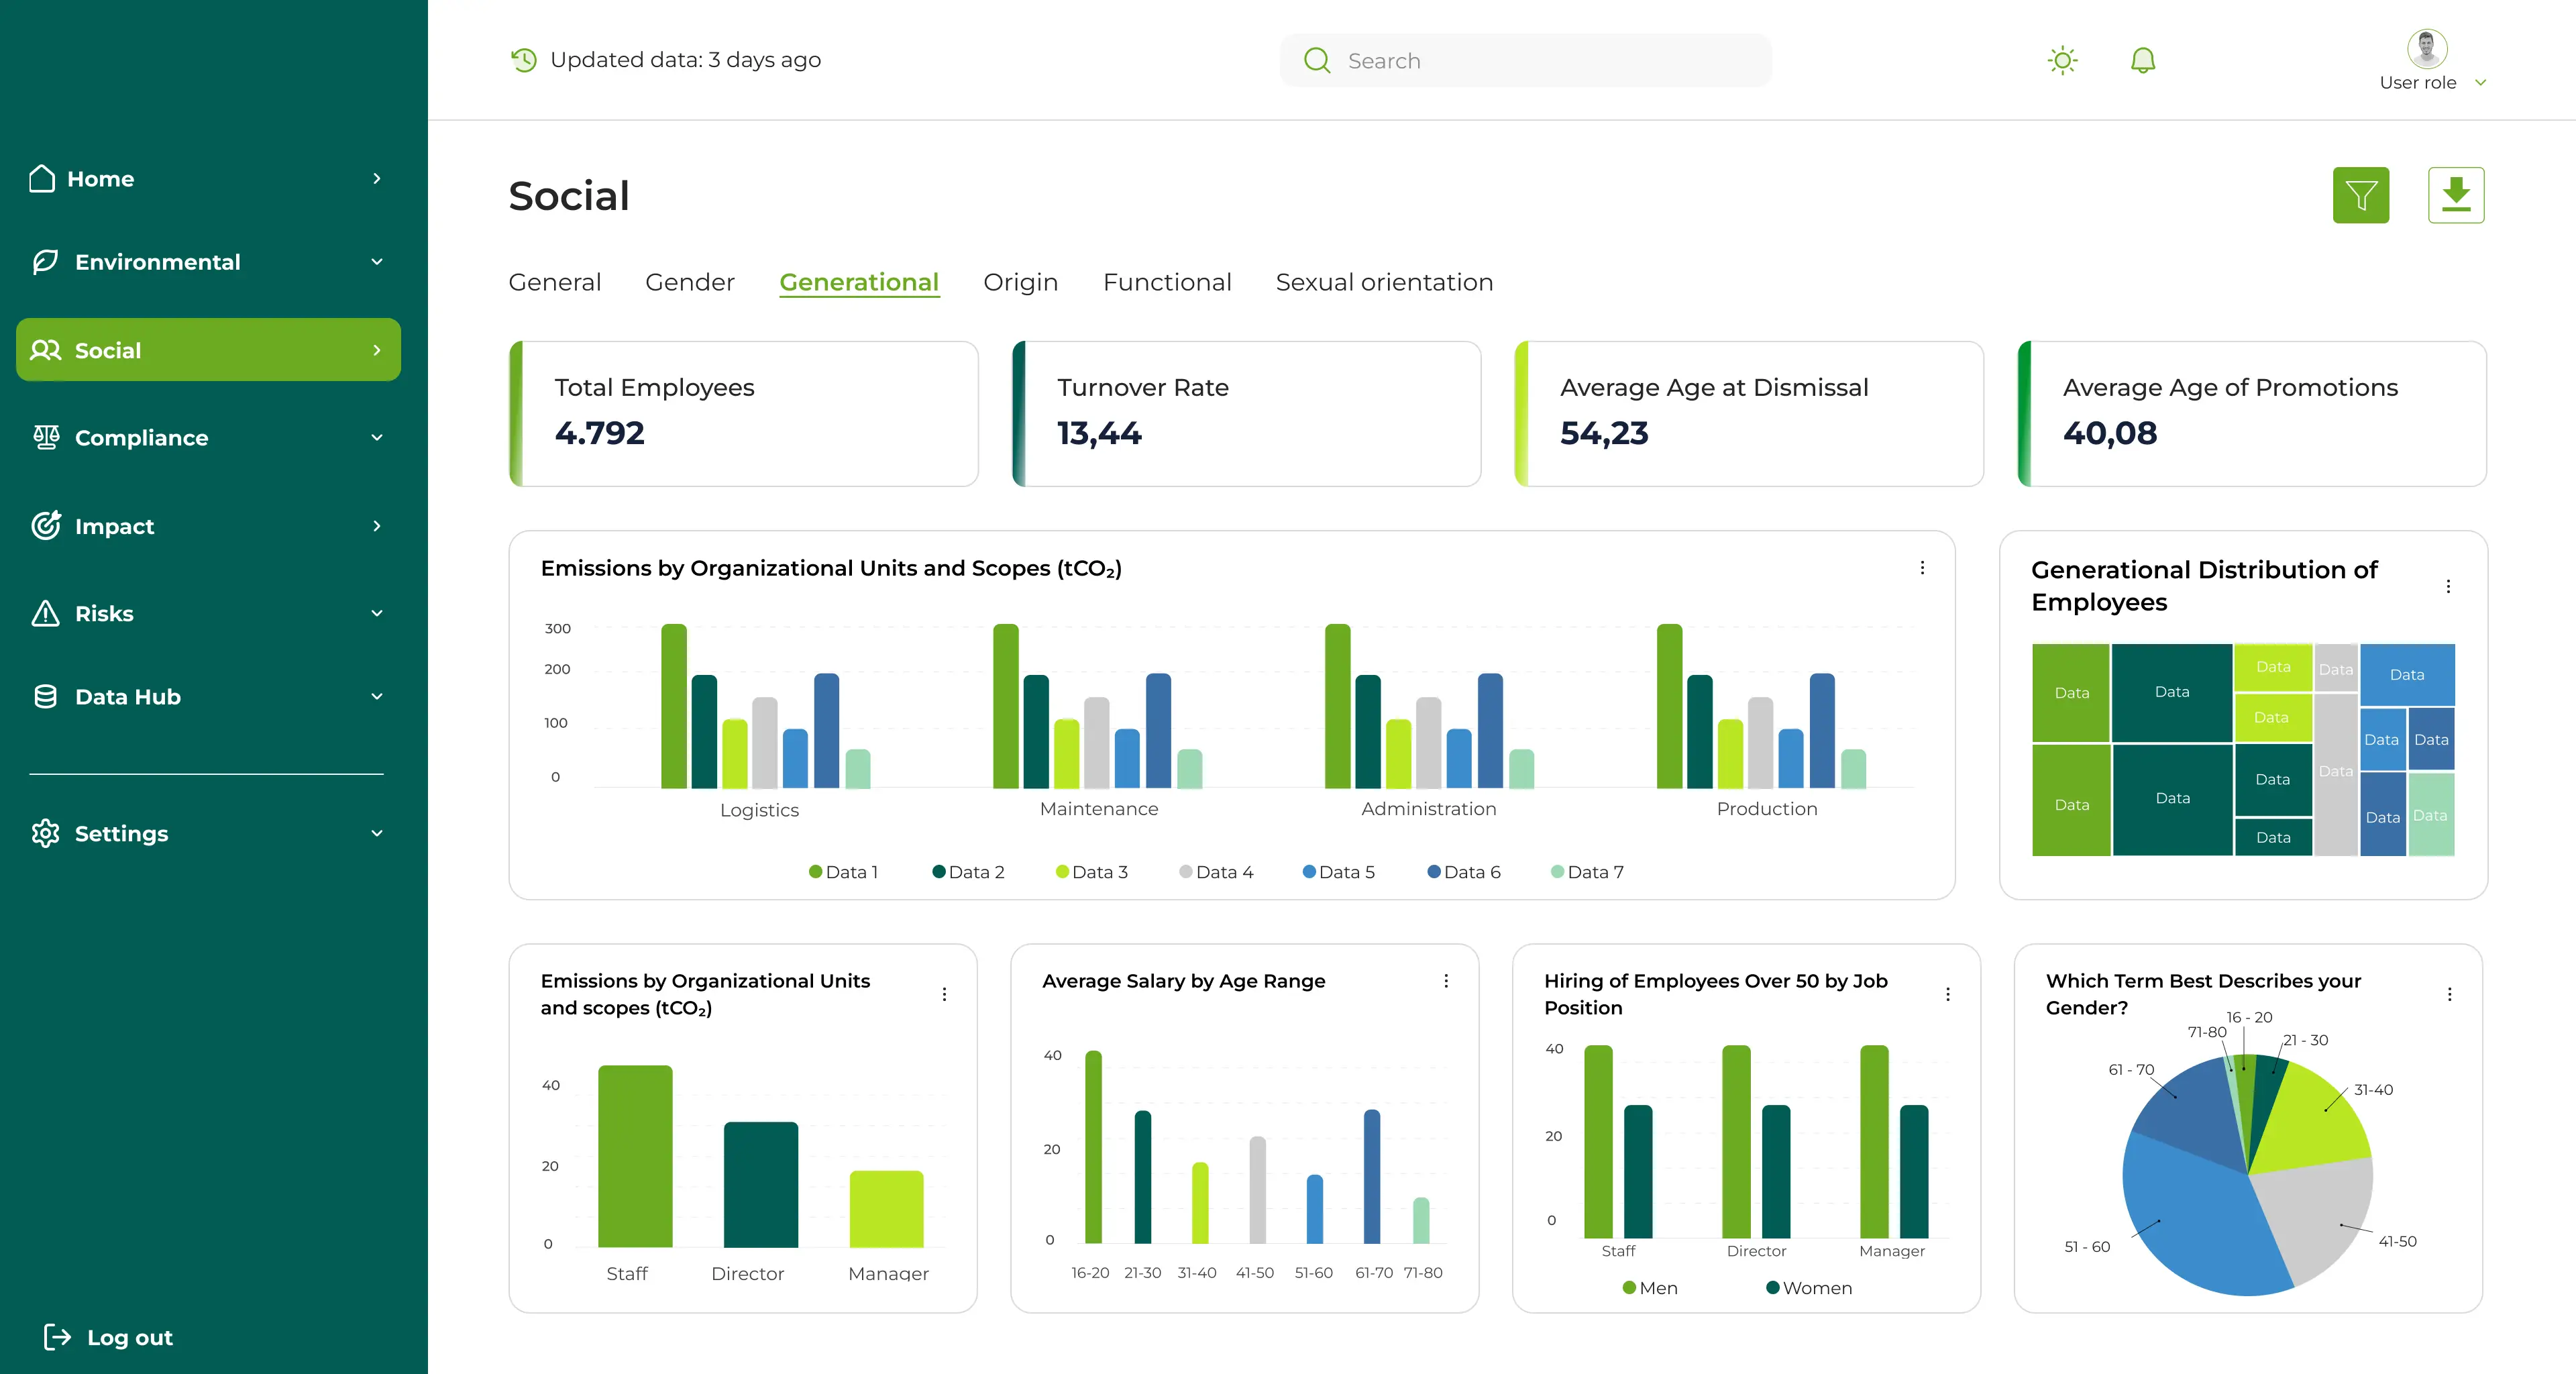
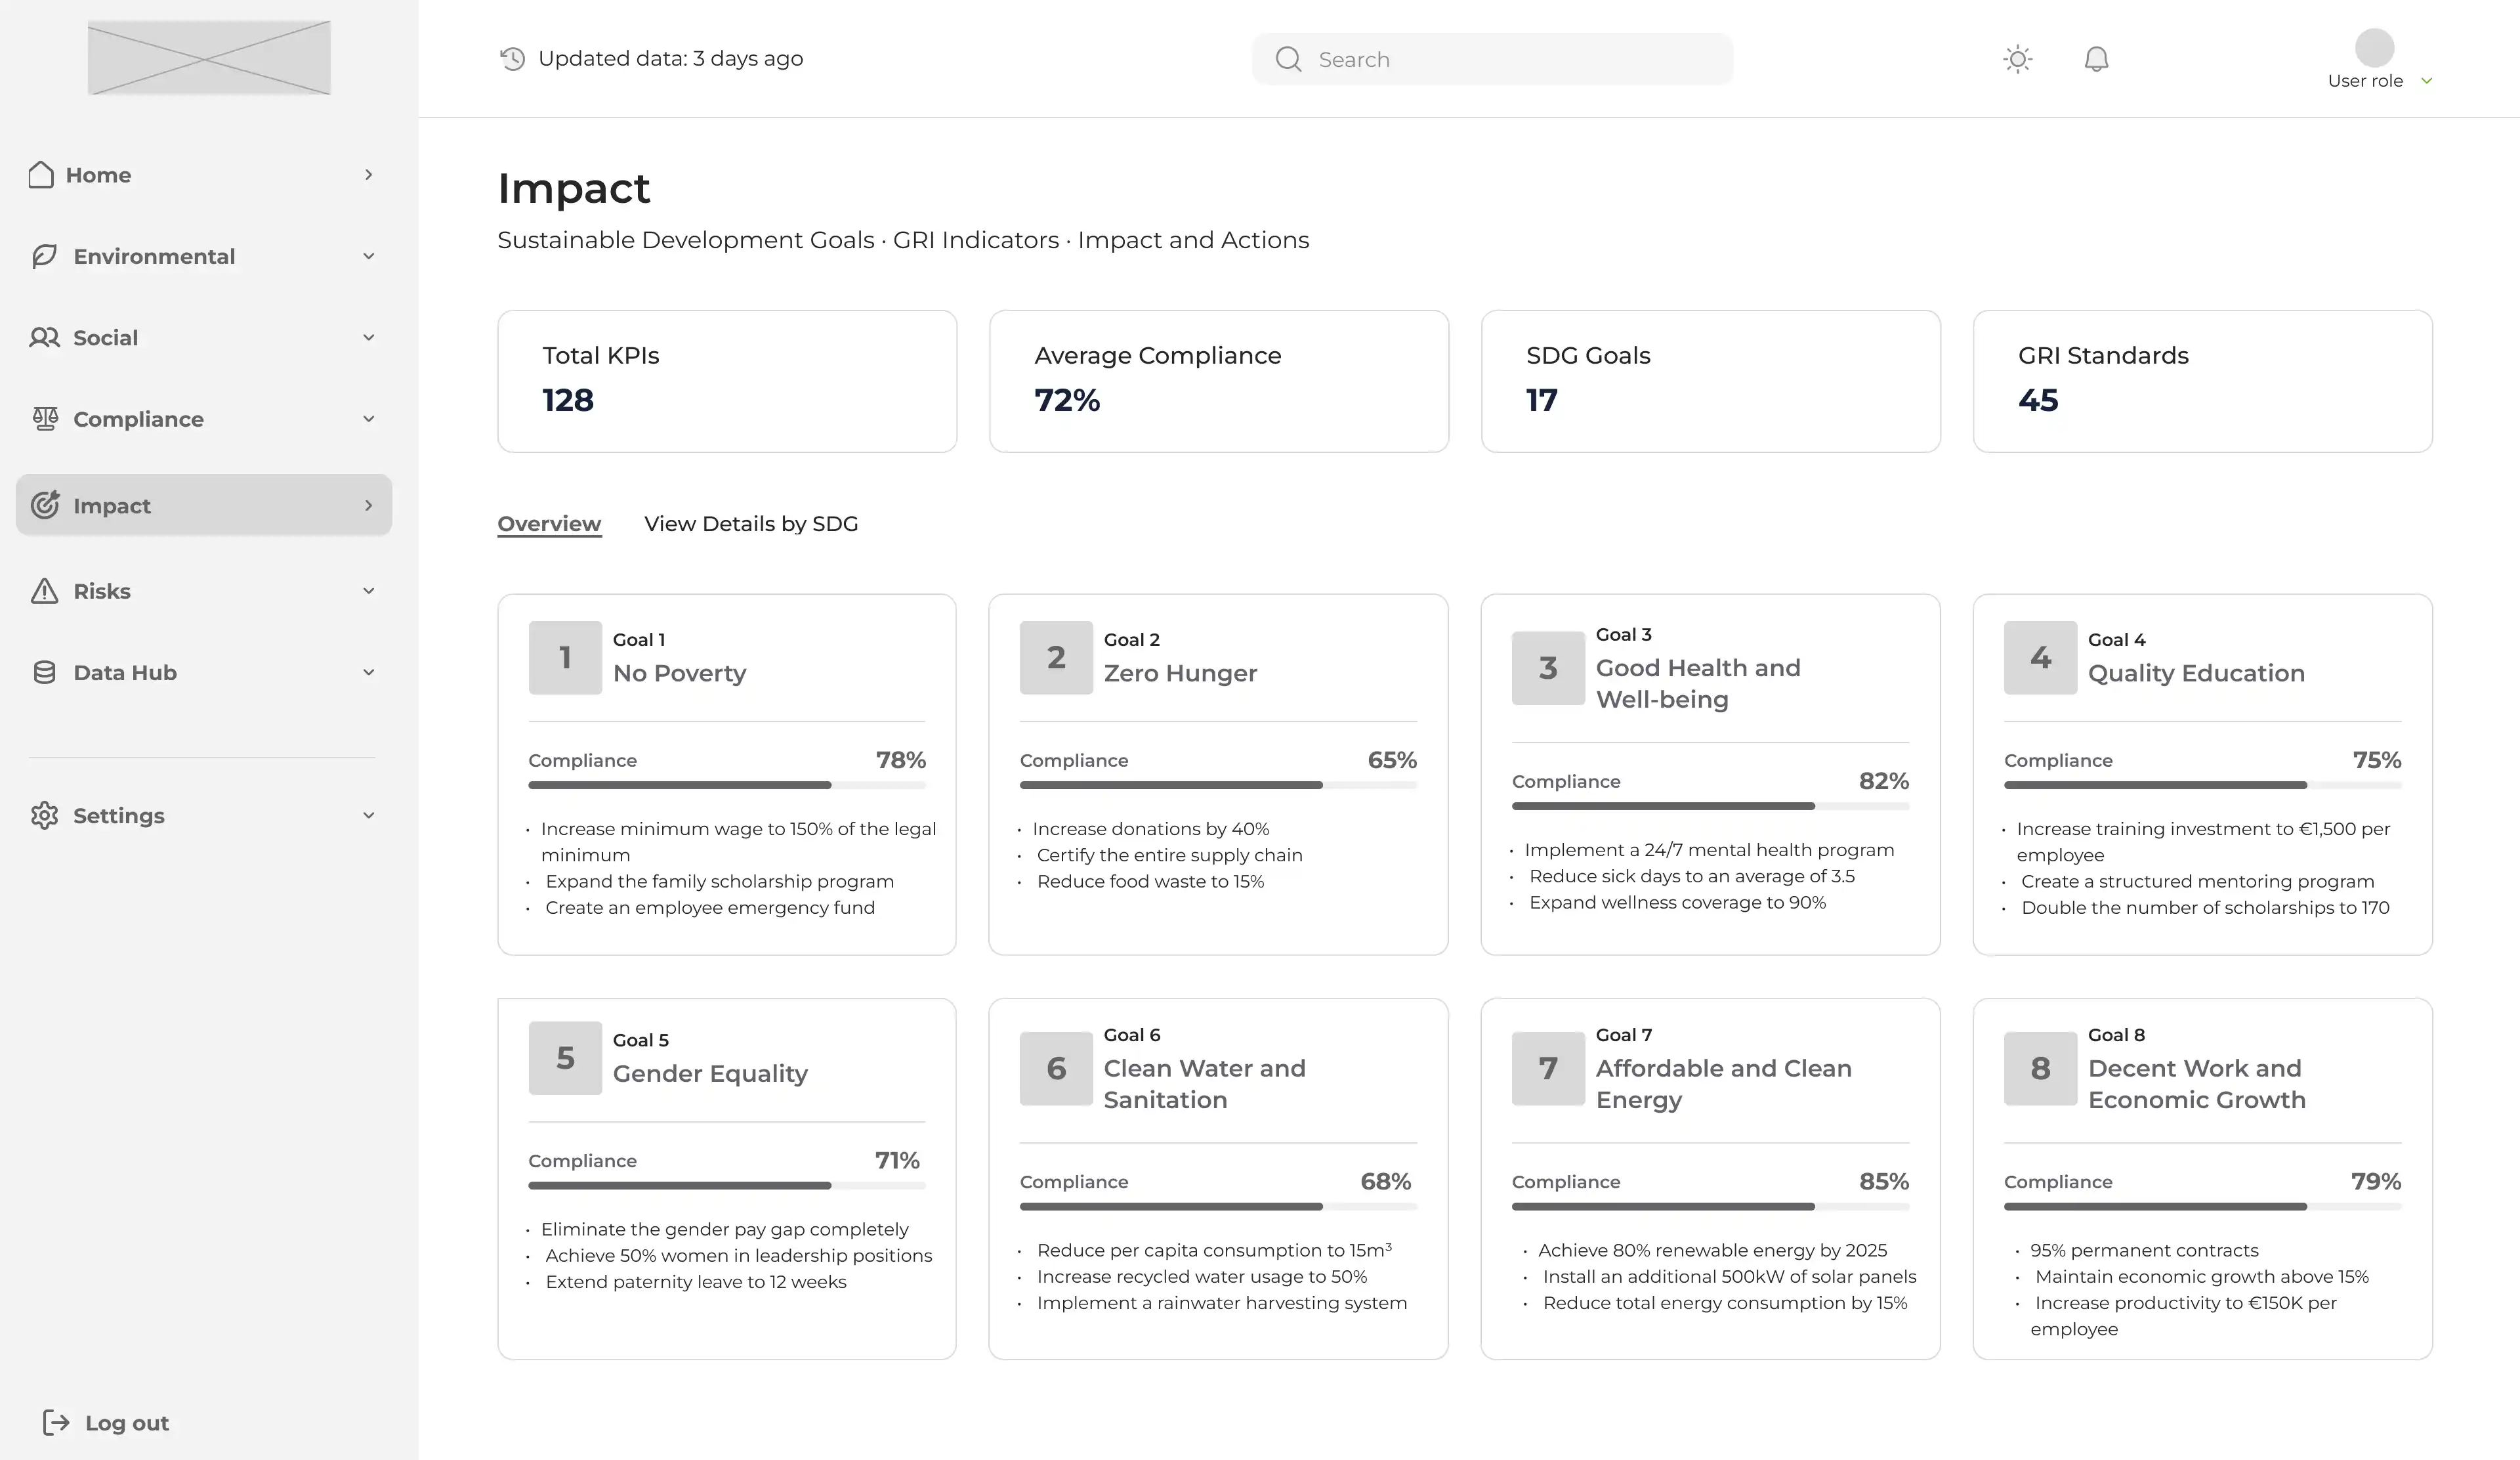
4. Dashboard architecture focused on clarity
Once the data foundation was reliable, I designed dashboards that helped users quickly understand performance.
Key principles:
- Prioritize high-level KPIs first
- Support drill-down exploration
- Role-based views for executives vs managers
- Clear hierarchy for actionability
The goal was not just visibility, it was decision confidence.
Dashboard layouts prioritized KPI clarity, drill-down exploration, and role-based visibility to support faster ESG decision-making
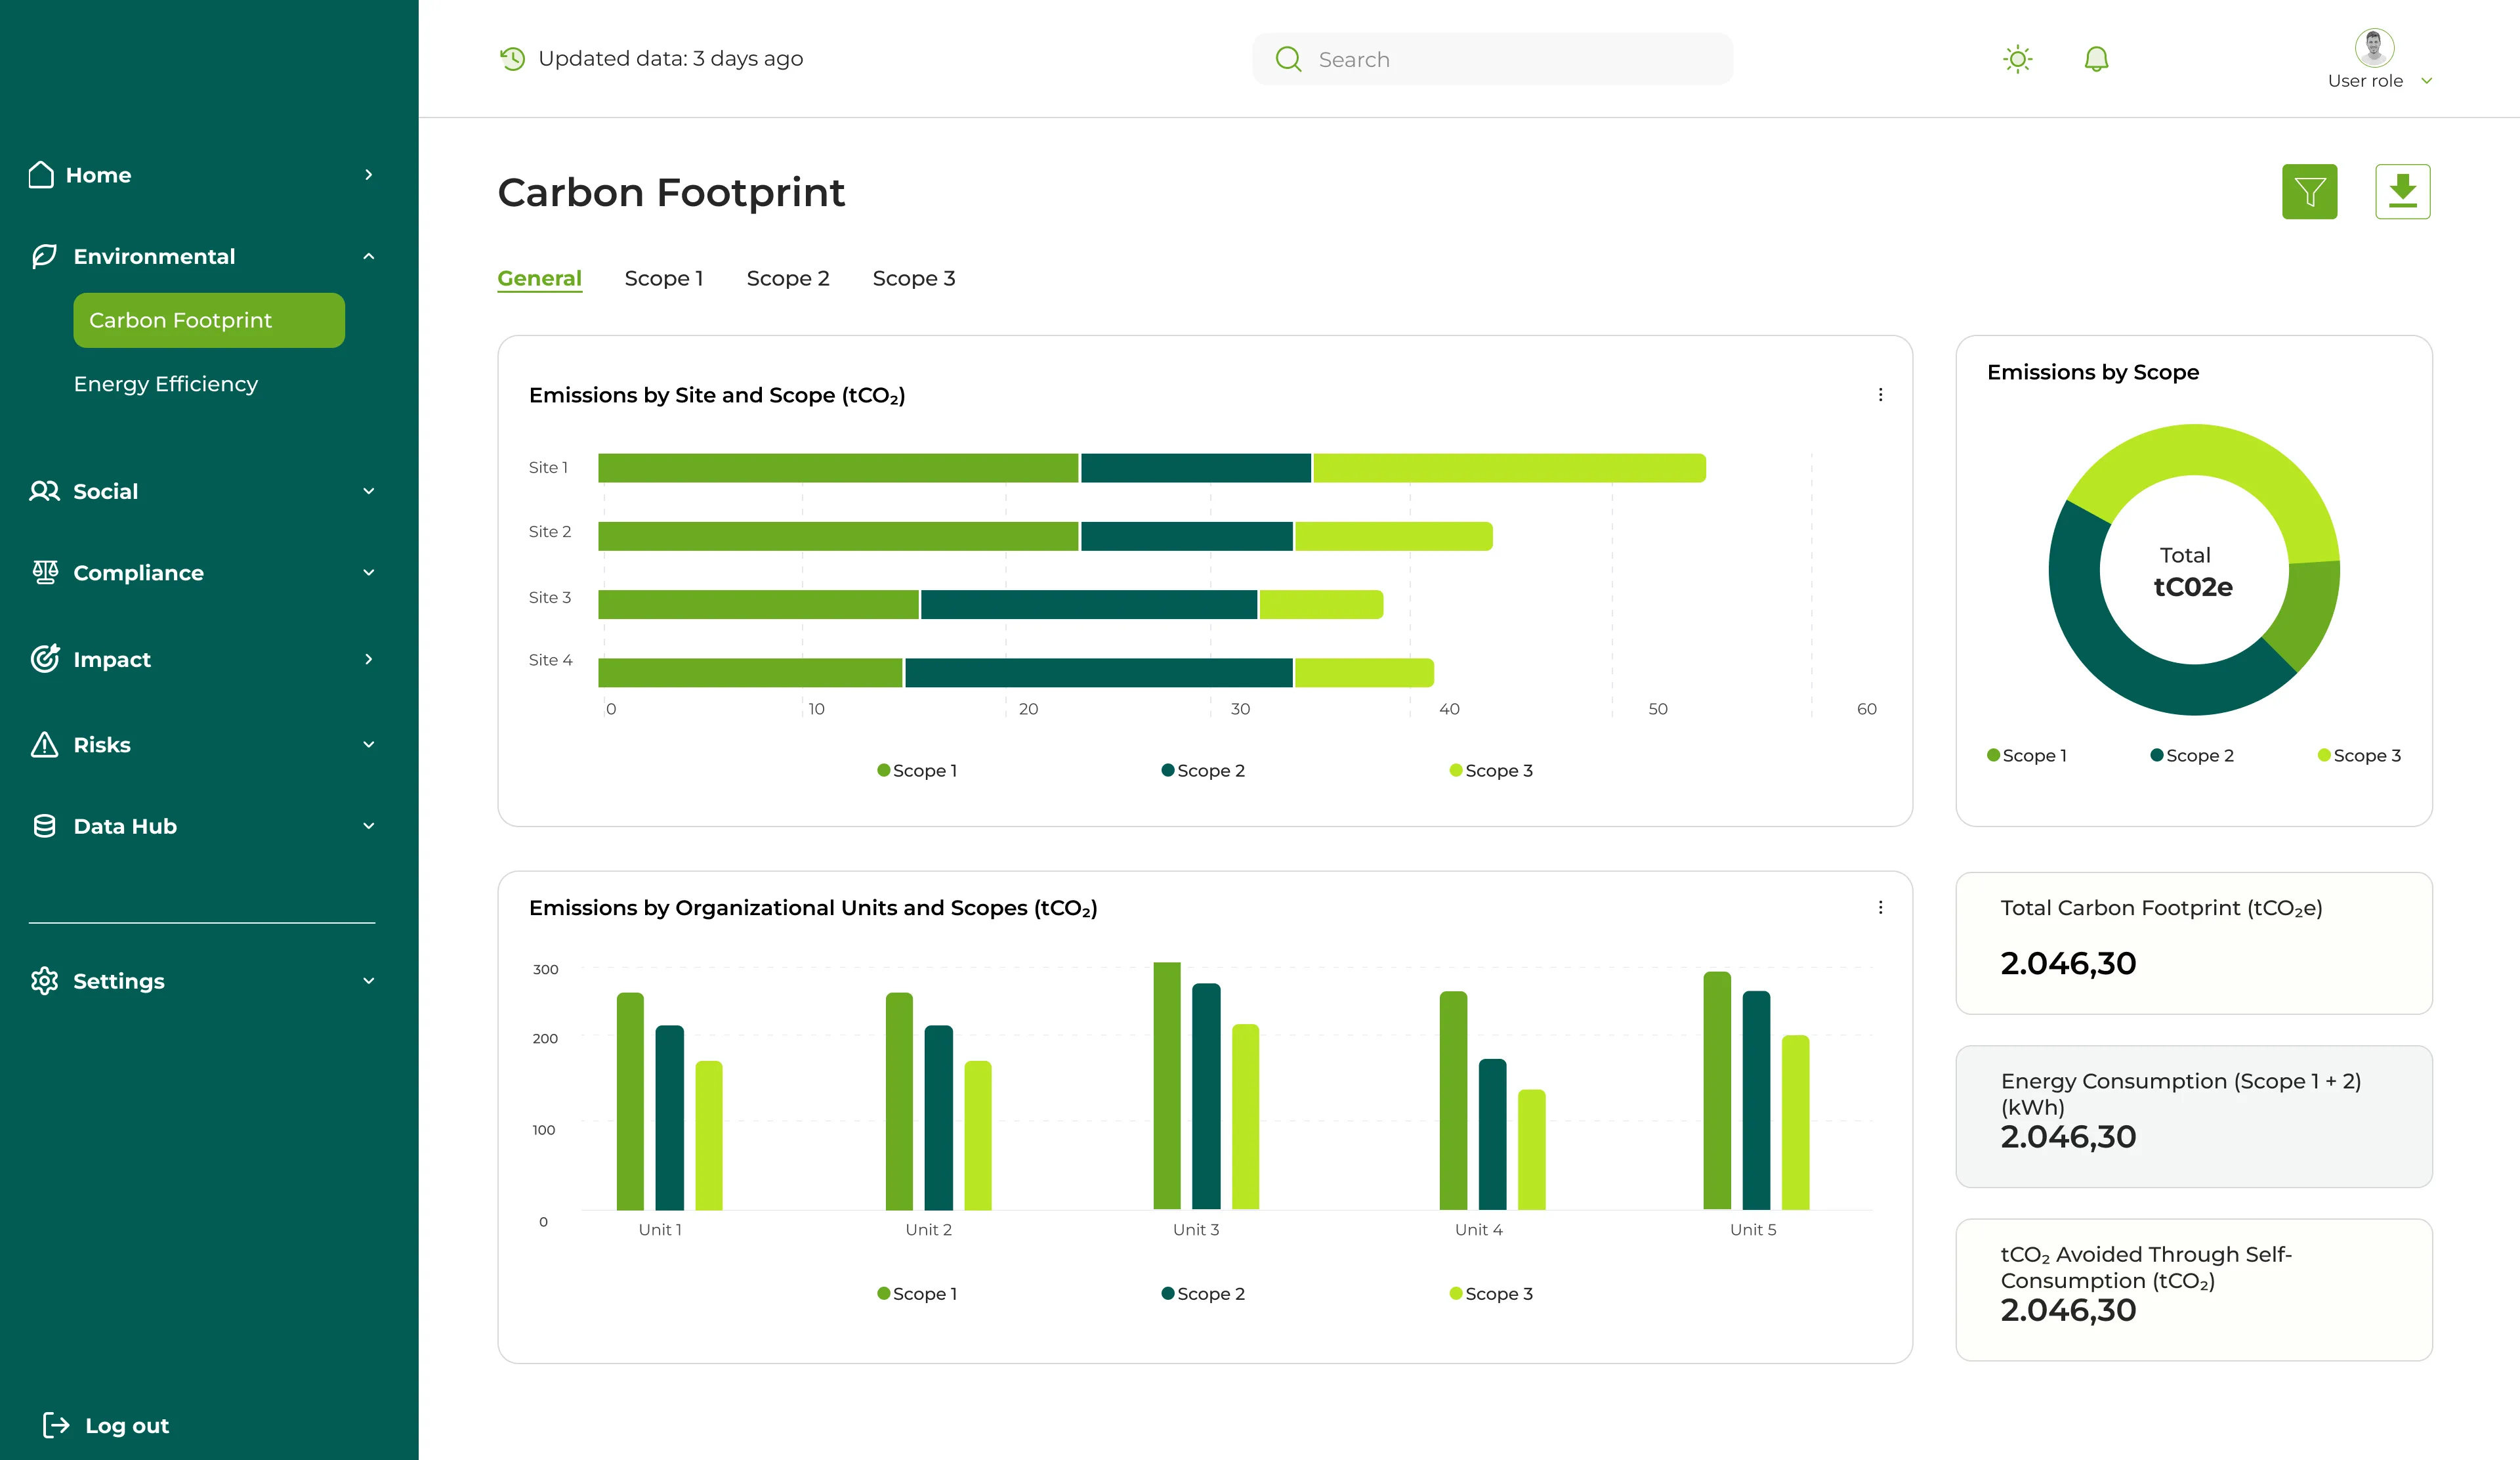
A modular dashboard system allowed different ESG areas to scale consistently while adapting to distinct operational needs
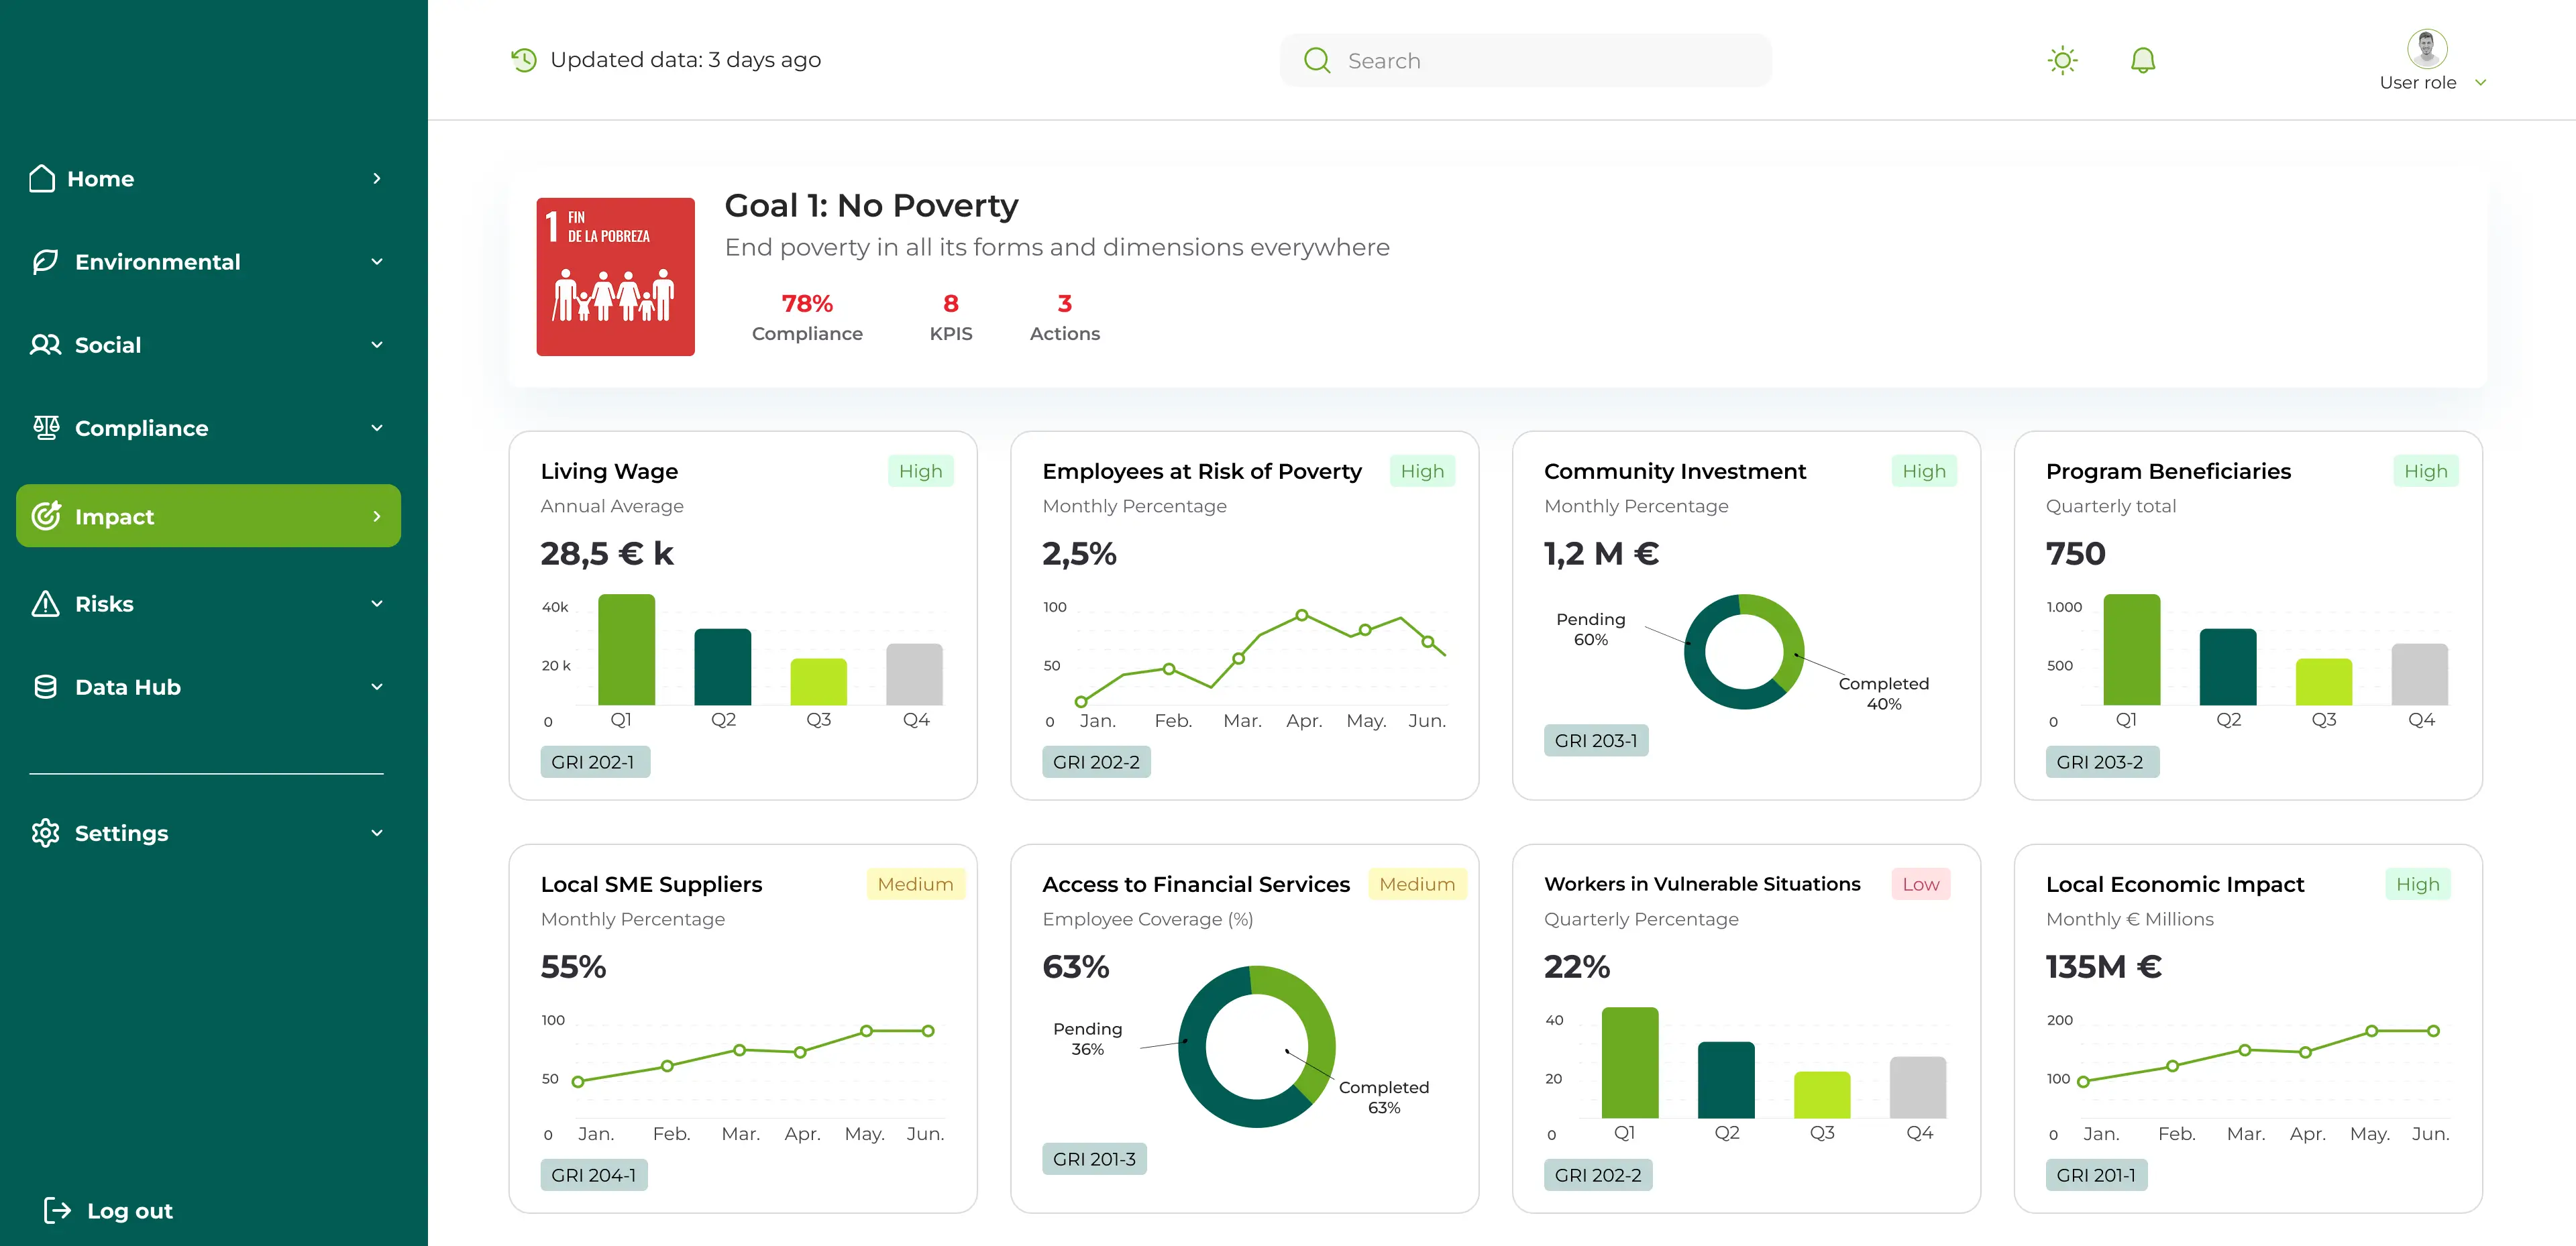
Detailed drill-down views enabled users to move from high-level ESG performance into deeper operational analysis
Early Impact
The MVP launched with 5 pilot companies. Within the first months of rollout, early results showed improvements in both operational efficiency and trust:I translated the insights into design principles: clarity, traceability, and interactivity.
- ~50% reduction in time spent consolidating survey inputs
- 32% fewer data inconsistencies due to structured validation
- 100% pilot adoption
- 80% CSAT
One sustainability lead shared: “For the first time, I can show our board the full sustainability picture in one place.”
What’s Next
Based on pilot learnings, the next product opportunities were focused on scaling trust and regulatory readiness:
- Expand Scope 3 emissions coverage for supply chain visibility
- Add risk and impact dashboards for deeper ESG analysis
- Support larger stakeholder assessments and benchmarking
- Explore anomaly detection to proactively flag data issues
Key Learning
Working on this project reinforced that in complex B2B products, UX is not just about making interfaces usable, it’s about making systems understandable, trustworthy, and scalable.
1. Simplifying complexity is the real design challenge
ESG data involves regulations, technical metrics, and multiple contributors. The real design challenge was simplifying complexity without oversimplifying the the trusted.
2. Transparency builds trust
In data-heavy products, clarity is not enough. Users need confidence in where information comes from, how it was processed, and whether it can be trusted.
3. Good UX starts before the dashboard
The quality of the final experience depended on solving the operational friction upstream: data collection, validation, and ownership.
4. Different stakeholders need different levels of control
Designing for adoption meant balancing simplicity for executives with depth and traceability for operational teams.
5. Product maturity also means knowing what not to build
Removing automated reporting from the MVP was a key reminder that focus often creates more value than feature breadth.
This project strengthened my belief that in complex systems, clarity and credibility are just as important as usability.
More Projects
A collection of projects showcasing my approach to solving complex UX challenges across different industries.
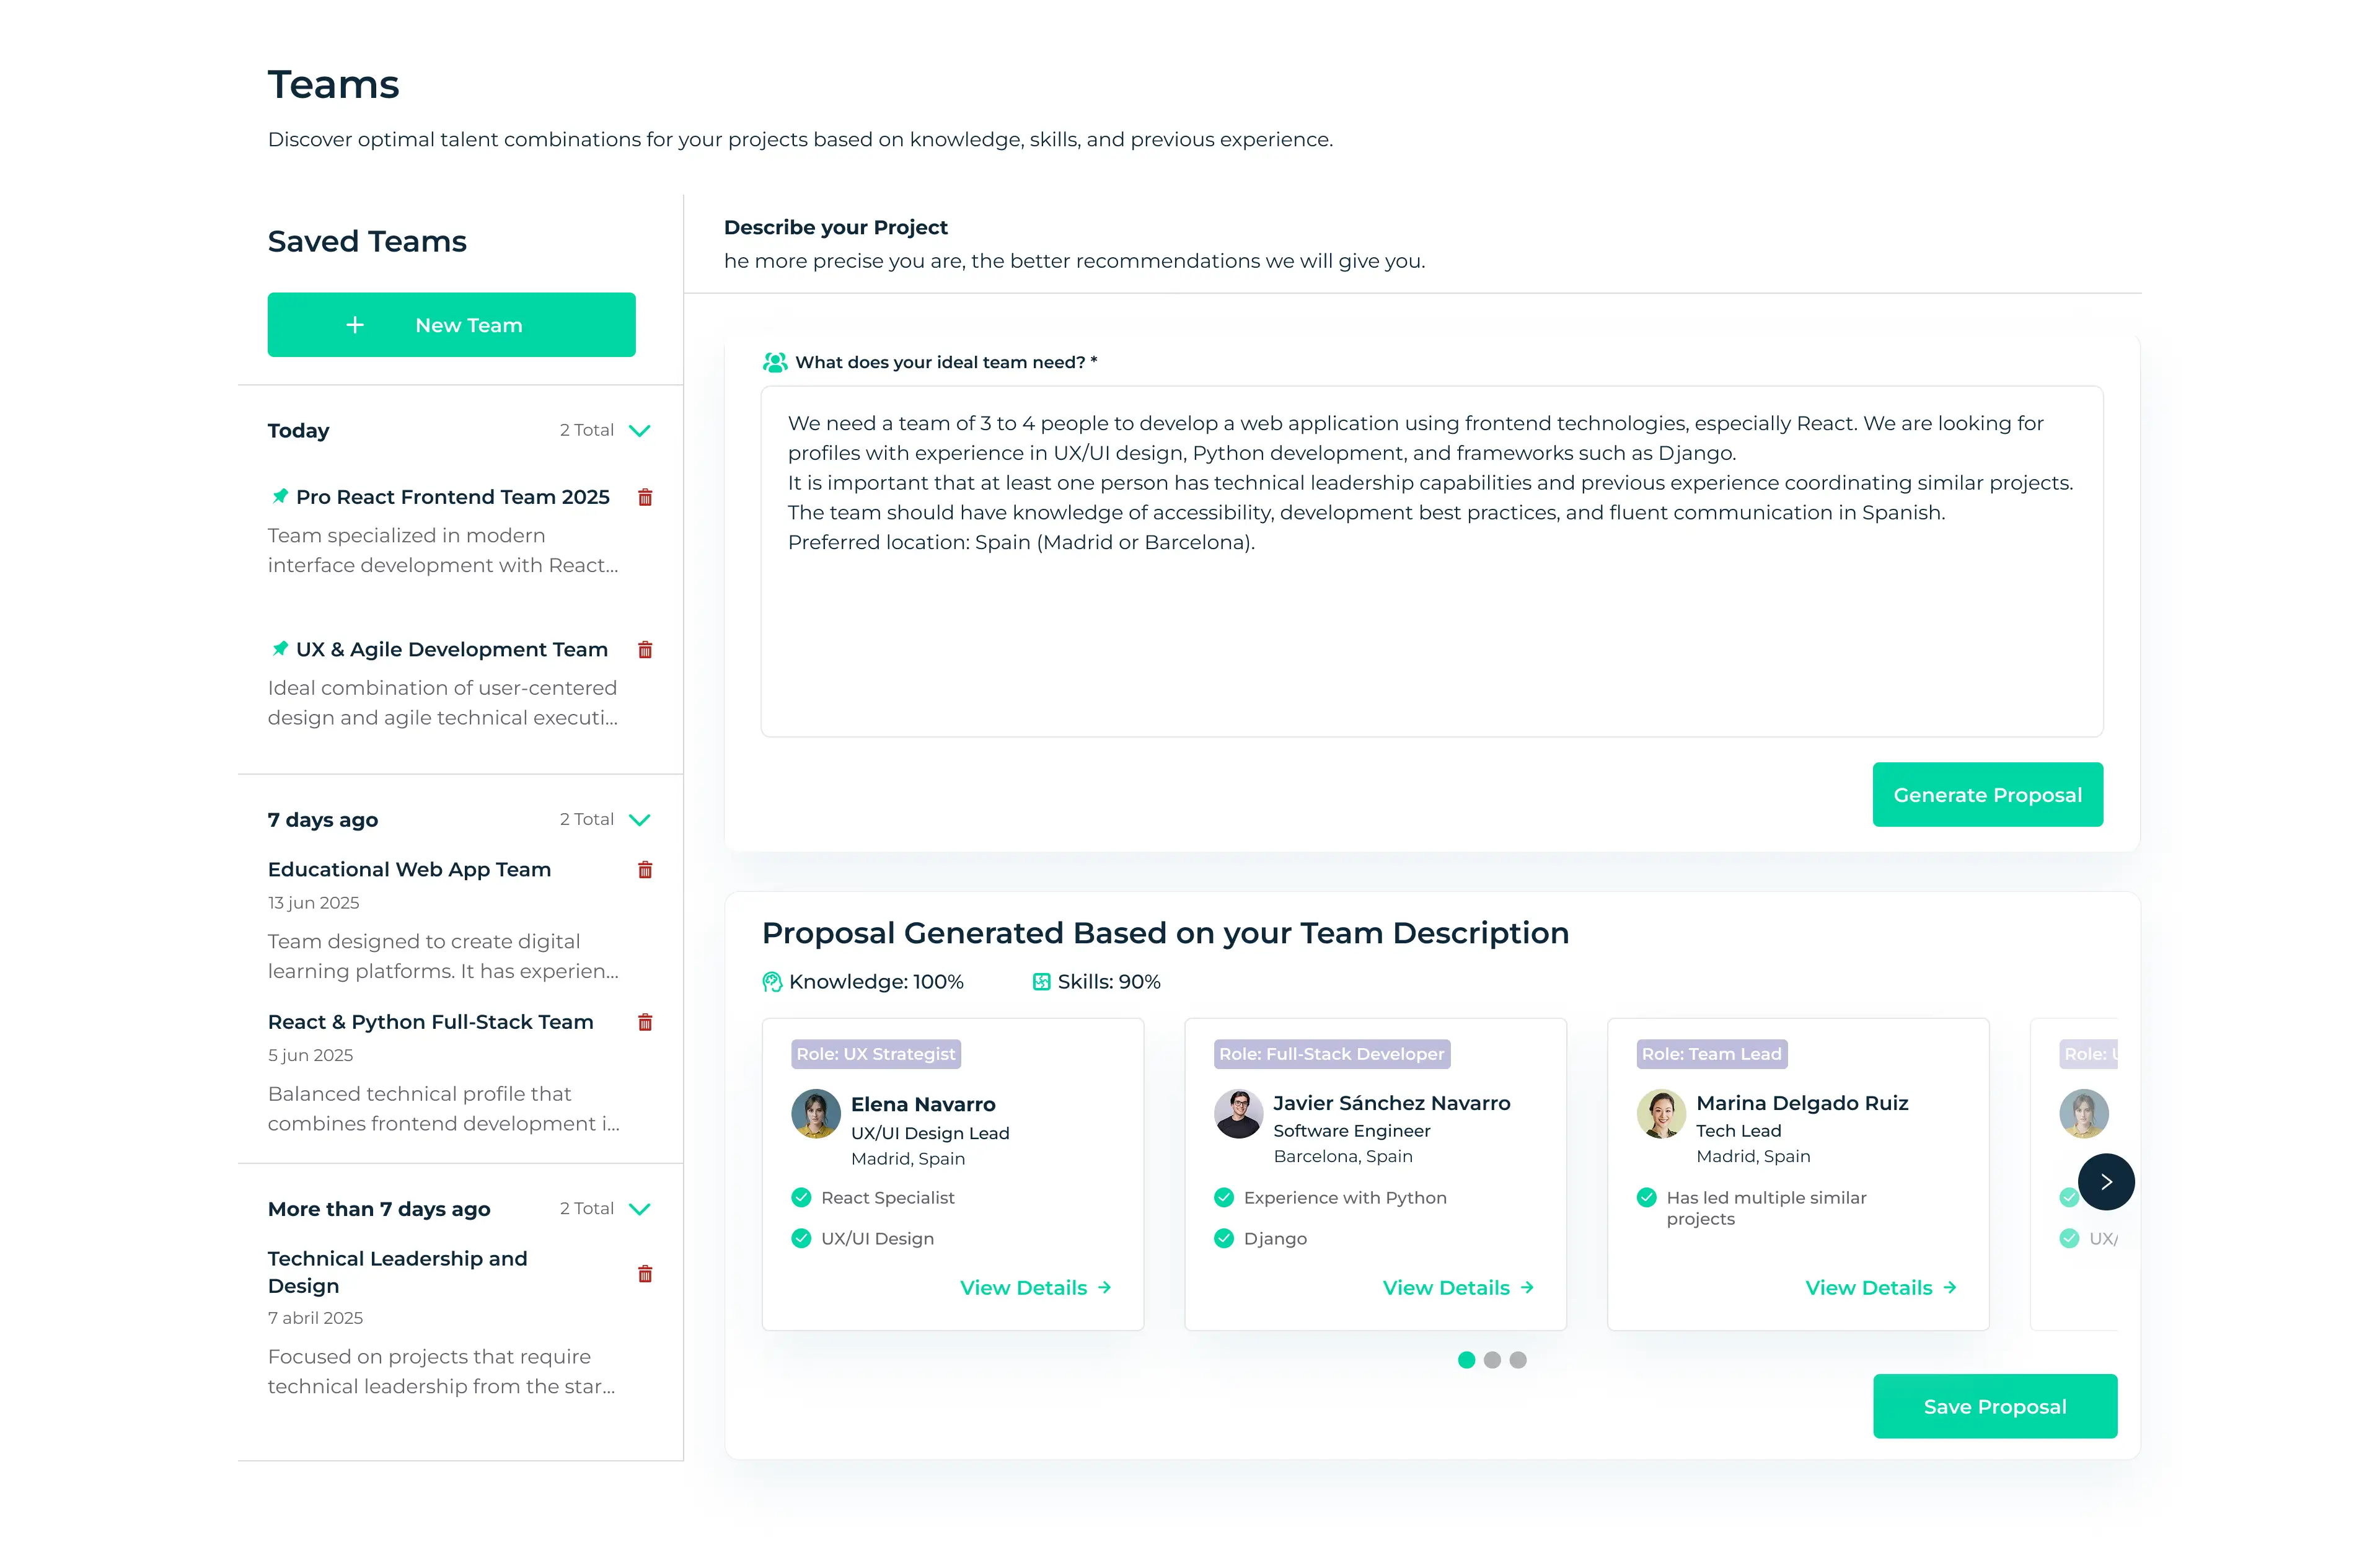
Talent Intelligence
Transforming workforce planning through AI-powered team generation and talent insights.
AI
SaaS
HR Tech
End-to-end product redesign
View Case Study
PharmaDocs
Simplifying compliant document management for HR teams in the pharmaceutical industry.
Documents
Workflows
Permissions
Document workflow design
View Case Study